

Photo: Author
Introduction
There is a massive influx of forecasts and wild guesses with regard to the fate of COVID-19 pandemic which has not just plagued the health system of even the most advanced (technologically and scientifically) societies but also tanked their economy into the whirlpool of one of the steepest recession of last one hundred years.
Epidemiologists and data analysts have been tossing complex theoretical as well as computer models to estimate the dynamics of COVID-19 growth rate and foretell the hard waited date of demise of the pandemic.
In this article, I have made an attempt to shed some light on the growth of COVID-19 confirmed cases and deaths by simply revealing some of the important probabilistic structures of the data made available by John Hopkins Coronavirus Resource Center. I will be using the global aggregate numbers ignoring the country specific data (though that will be even more interesting endeavor). The data used ranges from January 22, 2020 to April 19, 2020.
I am neither epidemiologist nor will I be using any theoretical knowledge about virus to do the analysis. Its purely a “digging the data” exercise for patterns and structures that might help us to explain what is going on and what is the most likely future for the pandemic.
Number of confirmed cases
Let us begin by looking at the trend of total number of confirmed cases.


Figure 1(a) is showing the number of global confirmed cases in original scale and Figure 1(b) is showing the same in log scale. The first one scares us with its exponential uphill trend. Within three months time, the number of confirmed cases increased from almost nothing to more than 2.4 million. Numbers in original scale (Figure 1(a)) is not showing any sign of plateauing or cycles; the curve turns much steeper after the first week of March, 2020.
But comparing numbers ranging from 0 to 2.4 million is a difficult task. So, usually data analysts take the log of the original data to produce Figure 1(b) revealing more twists and turns in the data compared to Figure 1(a). In the original scale (Figure 1(a)), patterns were hidden due to massive change in the number of confirmed cases.
There is one very interesting advantage of using log scale rather than original scale. Number of cases in log scale basically shows how the growth rate of confirmed cases is changing across time. Basically, the slope of the curve in Figure 1(b) shows the rate at which the confirmed cases are increasing. When the curve is steep, it is telling us that the growth rate is very high and when the curve is flat the growth rate is very low. A perfectly flat curve would mean no growth in numbers. When this curve is increasing at decreasing rate (such as before the second week of February), it means the growth rate might be high but is decreasing. If the curve is increasing at increasing rate (such as after the first week of March), this means the growth rate itself is increasing (scariest part of the pandemic).
We can clearly see two plateaus in the curve. See the area where the curve is flattest for an extended period.
The first plateau is around February 23. This one started loosing its ground after Italy and US emerged as two new epicenters of the pandemic (after Wuhan) between the second and third week of March. The second plateau: we might have just been able to approach by the end of the third week of April. As the first plateau did not last long, the second plateau cannot be guaranteed to last any longer either. Hopefully, we will not see another period of increasing at increasing rate like in those two middle weeks of March.
My uneducated guess is that the plateau will remain flat unless we jump to another highly populated epicenter in other part of the globe or the existing epicenters of Europe and US gets out of control rise in number of confirmed cases due to untimely end of state enforced (and WHO recommended) preventive measures.
With just a couple of epicenters having been moving around the globe, predicting the rise of another pandemic epicenter is an epistemological impossibility. Being hopeful is one thing, but being doubtful and humble is the need of the time.
Number of deaths
Again, the number of deaths in original scale reveals very little data structure than in log scale. Surprisingly, the curve for number of deaths due to COVID-19 globally also exhibits seemingly similar pattern. See Figure 2(a) and 2(b) for the number of deaths in original and log scale respectively.
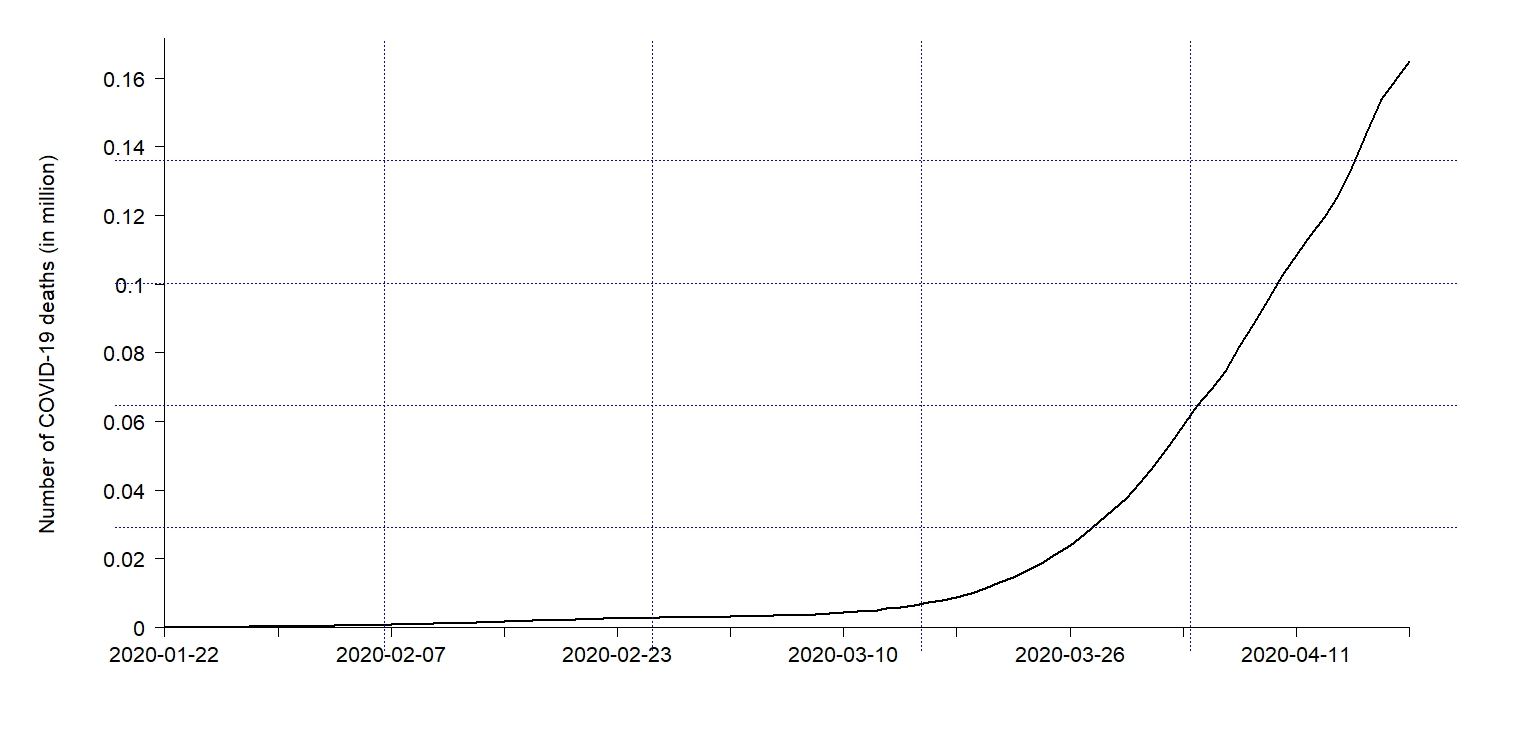

The occurrences of the two (I am open for a claim of a different number) plateaus happen to happen one week or so later than the plateaus for the number of confirmed cases. I am yet to estimate the exact time lag between the number of confirmed cases and deaths. We might be slowly approaching the second plateau of stable and zero growth in number of deaths towards the end of April or the first week of May. But this is just a guess. We never know. A massive theoretical and empirical exercise would need to supplement this claim.
The growth rates of confirmed cases and deaths
Now, let’s look at the growth rate of the confirmed cases and deaths themselves directly. Higher the growth rates, higher would be the rise in numbers (Confirmed cases or deaths) from previous day. Zero growth rates would indicate no new confirmed cases/death. This is what we all want to see as soon as possible so that we can jump start our lives and our economy.

Last week of January records some of the highest growth rates for both confirmed cases and deaths. The growth rate of confirmed cases and deaths exceeds 64% and 47% on January 28th and 25th respectively. It is natural for the growth rates to be high and fluctuating massively when the numbers are small (during the initial phase of the pandemic). This is one good reason to exclude the data for December, 2019 when making global analysis. If the number of cases increase from 1 to 2, that is a growth of 100%. But if the number of cases grow from 10000 to 11000, its an increment of just 10%. So, just looking at absolute numbers or even percentages would not be sufficient to have an adequate picture of the situation.
Couple of things can be noted in Figure 3. The growth rate of confirmed cases and deaths go hand in hand almost perfectly. Both growth rates peak and trough together. Spikes in both occur simultaneously; meaning more confirmed cases and more deaths are just the two sides of the same coin. One implies the other.
As can be seen in Figure 3, the growth rate plummeted to almost zero percentage (i.e. no increase in number of deaths and number of confirmed cases) around February 23, 2020, a week or so before the epicenters moved from Wuhan to Europe and US. After this trough in late February, the pandemic epicenter roared back louder in its new locations. If the growth rate had stayed where it was in February, 2020 (maybe if the new epicenters did not emerge), the pandemic might not have reached the global scale taht we have now. But it did.
Fortunately, he growth rate for neither the confirmed cases nor the deaths could barely exceed 10%, around March 26, 2020. Since then, the growth rate has been steadily falling down towards zero. At present it stands at 3.5% and 3.4% for confirmed cases and deaths respectively. As pointed out earlier, these meager increments takes a huge toll in terms of numbers as we are talking about 3.5% of more than 2.4 million and not 64% of less than ten thousand. But the good news is that 0% of any number, be it 10000 or 2.4 million, is zero. Of course, getting closer to zero growth rate for confirmed cases and deaths is a meaningful (and hopefully achievable) goal to aim at.
The growth rate might continue to fall towards zero percentage if the pandemic is unable to find the new epicenter (this is my raw hypothesis). The growth rate might fall to zero in a couple of weeks time, hopefully. I am yet to do a formal modeling exercise to make precise prediction with confidence interval. Will post the results in the same article once I am done.
Concluding remarks
Prediction is always imperfect even if one has all (literally “all”) the information with no measurement errors, which we will never have. Future is full of uncertainties and dark hidden corners. The only reliable and plausible thing one can do is to explain what has been observed and expect the future repeat the similar pattern.
Expectations might be fulfilled. Prediction might turn out to be disastrous. Prediction of exact dates of next epicenter or next pandemic or next earthquake is no more than a beautiful dream for a statistician. But one might be able to reliably predict how often they might hit us hard in a given interval of time scale in future. And we can insure ourselves accordingly by appropriating enough premiums in the form of health infrastructure, research, lab, knowledge sharing, human resources and international cooperation.
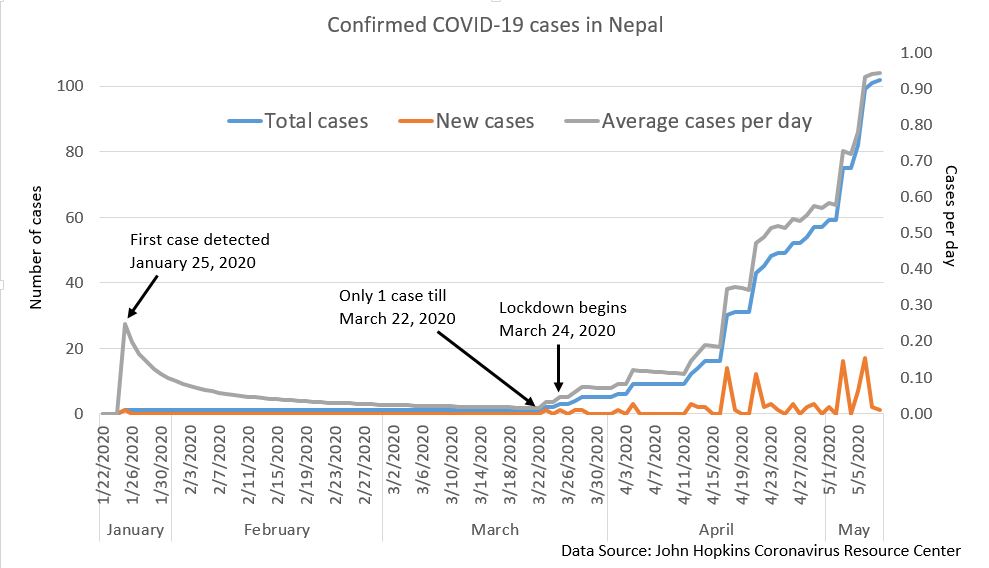
Confirmed cases in Nepal till May 8, 2020
There has not been any reported case of death due to COVID 19 in Nepal. The time series data for Nepal looks like Figure 4. The number of cases stayed at 1 till March 22. After that, it has been experiencing steady (not so much exponential) rise in number of confirmed cased (though its very difficult to predict the trajectory with only around hundred cases.
Unfortunately, my hypothesis was falsified by last few weeks data from Latin America and to some extent from Russia and India. The new epicenter has definitely emerged in Latin America. Worse, India is not yet no where near being out of the wood. The daily confirmed cases is increasing every day (On May 29, 2020, there were 7400 confirmed cases, highest in the recorded history).
Now, let us look at daily global new confirmed cases of the virus. It was growing exponentially until the first week of April. After April first week, it has stabilized a bit with seemingly extended cyclical pattern.

The pandemic will subside only when these numbers start to fall, steadily or rapidly. With the rise of new epicenters, its unlikely to happen.
The focus of the global community can be to stop the emergence of newer epicenters.